
Niger J Paed 2016; 43 (1): 15 – 19
ORIGINAL
Arowosegbe AO
Diagnostic value of procalcitonin in
Ojo DA
neonatal sepsis
Dedeke IOF
Shittu OB
Akinloye OA
DOI:http://dx.doi.org/10.4314/njp.v43i1.3
Accepted: 27th April 2015
Abstract :
Introduction: Neonatal
infection was also included. Pre-
sepsis is a major cause of mortal-
dictive values and area under the
Arowosegbe AO (
)
ity in developing countries. Accu-
receiver operating characteristic
Ojo
DA, Shittu OB
rate and quick diagnosis are diffi-
curve (AUC) of PCT were evalu-
Department of Microbiology,
Federal University of Agriculture,
cult because clinical presentation
ated.
Alabata, Abeokuta, Ogun State,
are non-specific, bacterial cultures
Result: Of
the 85
neonates, 19
Nigeria.
are time-consuming and other
(22.4%) had positive blood cul-
Email: adearowosegbe@gmail.com
laboratory tests lack sensitivity
ture. PCT level was significantly
and specificity. Serum procalci-
higher in neonates in all sepsis
Dedeke IOF
tonin (PCT) has been proposed as
groups in comparison with those in
Department of Pediatrics,
an
early marker of infections in
the control group (P< 0.05). At a
Federal Medical Centre, Abeokuta,
neonates.
cut-off of 0.5 ng/ml, the negative
Ogun State, Nigeria.
Objectives: This
study investi-
predictive value (NPV) of PCT
Akinloye OA
gated the value of PCT in the di-
was 80% and the positive predic-
Department of Biochemistry,
agnosis of Neonatal Sepsis.
tive value (PPV) 39%. There were
College of Biosciences, Federal Univer-
Methods: Neonates
undergoing
no
significant statistical difference
sity of Agriculture, Abeokuta, Ogun
sepsis evaluation at the Special
between the AUC values of PCT
State, Nigeria.
Baby Care Unit, Federal Medical
in
Early onset and Late onset sep-
Centre, Abeokuta, Nigeria be-
sis, as well between AUC in Pre-
tween January and April 2013
term and term cases. A higher per-
were included. Blood samples
centage of neonates who died
were obtained for white cell
(96%) had elevated PCT levels
count, blood cultures, serum CRP
compared to those who survived
and PCT analysis. Neonates were
(46%).
categorised into Proven Sepsis,
Conclusion: These
findings sup-
Suspected Sepsis and Clinical
port the usefulness of the PCT in
Sepsis groups on the basis of
diagnosis of Neonatal sepsis.
laboratory findings and risk fac-
tors. A control group with no
Keywords: Neonatal
Sepsis , Diag-
clinical and biological data of
nosis, Procalcitonin, Receiver
Operating Characteristic Curve
Introduction
tain blood sample for serial blood culture from infants
3 .
Therefore, there is need for newer diagnostics methods
Neonatal sepsis is one of the important causes of neona-
to
obtain a rapid indication of the infectious status of
tal morbidity and mortality particularly in the develop-
neonates with suspected sepsis. In recent years, the
ing
countries . An early diagnosis of neonatal septicae-
1
search for diagnostic tests for sepsis in newborn infants
mia
helps the clinician in instituting antibiotic therapy at
has
turned to cytokines as well as to other substances
the
earliest, thereby reducing the mortality rates in the
associated with the inflammatory response, in some
neonates. Early recognition and diagnosis of neonatal
cases induced by cytokines, as possible indicators of
sepsis are difficult because of its variable and non-
infection.
specific clinical presentation. Isolation of the causative
microorganisms by using blood culture has been the
Among them, serum procalcitonin (PCT) is one of the
most promising . PCT, a 116-amino-acid protein with a
4
gold standard method for its diagnosis. However, as
pathogens in blood cultures are only detected in approxi-
molecular weight of 13 KDa, is the precursor in the syn-
mately 25% of patients, the sensitivity of blood culture
thesis of calcitonin (CT). Firstly demonstrated to in-
is
suspected to be low . Besides, it is impractical to ob-
2
crease at the onset of bacterial infection and sepsis by

16
13
21
Assicot et al in 1993 , this acute phase reactant has the
5
Magudumana et
al ., 2000 ,White et
al ., 2007 and Bal-
lot et al ., 2004 ) as follows: (a) Group І (
proven sepsis):
12
characters of acute phase proteins, hormones and cyto-
kines. Serum PCT concentration rises 2-4 hours after
Clinical signs and symptoms with positive blood culture.
endotoxin injection, reaches its peak level right after 6
(b)
Group ІІ ( suspected sepsis): Clinical signs and symp-
hours,
maintains a plateau through 8 to 24 hours and
6
toms with negative bacterial culture but with positive
decreases to its normal level if the infection stimulus
screening test (CRP, WCC). (c) Group III (clinical sep-
stops. It has been reported to be a reliable marker for
sis): Clinical signs and symptoms with negative bacte-
severe bacterial infections and sepsis .
5
rial culture and negative screening test. Patients were
Procalcitonin levels are undetectable in healthy indi-
placed into 3 groups rather than just present and absent
viduals and slightly increased in severe viral infections
infection as it is acknowledged that some babies with
and non infectious inflammatory responses . The results
7
sepsis will have negative blood cultures. Excluding the
of
recent studies suggest the usefulness of PCT for early
patients with possible infection would result in the po-
tential exclusion of some patients with actual infection .
12
diagnosis of neonatal sepsis , although other investiga-
8,
9
tors have observed lack of accuracy for this marker .
10
A
control group consisting of 12 healthy neonates with
This study aims at evaluating procalcitonin as an early
no
clinical and biological data of infection in an immu-
or
first line marker in the diagnosis of neonatal septice-
nization clinic prior to immunization was also included
mic infection.
in
the study.
Data was analyzed using SPSS for windows version
17.0. Statistical test between variables was done using
Methods
Chi-squared test ( χ2). Where the numbers in a cell was
less than five, a Fisher's exact test was used. Differences
In
this prospective cohort study, all neonates undergoing
between groups were assessed by z-test. A p value <0.05
evaluation for sepsis at the Federal Medical Centre,
was considered significant for all statistical tests. Diag-
Abeokuta between January and April 2013 were eligible
nostic efficiency was defined by sensitivity, specificity,
for inclusion. Written consent was obtained from the
positive predictive value (PPV) and negative predictive
value (NPV). In line with Ballot et al., 2004 , Group I
12
parents/guardians of all the investigated neonates. Ethi-
cal clearance was obtained from the Research and Ethi-
and Group II
patients were regarded as positive,
cal Clearance Committee of the hospital. For each baby,
whereas Group III group was regarded as negative. Re-
a
written informed consent was also obtained from the
ceiver operating characteristic (ROC) curves were also
parent(s) or guardian. Neonates suspected on clinical
constructed. . The closer the ROC curve is to the upper
left corner, the higher the overall accuracy of the test .If
14
grounds to have sepsis were included in the study at the
point of admission or while on admission in the hospital.
the p-value of an ROC curve is less than 0.05 (P<0.05),
Exclusion criteria were obvious congenital anomalies or
there is evidence that the laboratory test does have an
prior antibiotic therapy. The clinical criteria for the
ability to distinguish between the two groups.
evaluation of sepsis were: Maternal risk factor such as
fever, prolonged rupture of amniotic membrane >24hr;
Results
Neonatal history: low birth weight (< 2500 grams), pre-
Patients’Characteristics
term birth (<37 weeks); Signs and symptoms of sepsis:
Respiratory distress, refusal to feed, convulsion, poor
There were 180 neonates admitted during the study
cry, abdominal distension, high pitched cry, irritability,
period and 105 of them met the inclusion criteria.
apnea, and palor.
Twenty of these 105 neonates were excluded from the
study. The study group included 85 neonates with sus-
A
sepsis work-up which included white cell count
pected (presumed and probable) neonatal sepsis (Table
(WCC), blood culture and PCT and CRP level determi-
1). Of these 85 neonates, 45 were females (52.1%) and
nation was done for all neonates enrolled. Procalcitonin
40
were males (47.9%). The mean age of the partici-
level was determined using the BRAHMS PCT-Q test
pants at enrolment was 3.4±0.5 days and the mean
kit, a semi-quantitative detection of PCT. At a PCT con-
weight was 2.5± 0.8 Kg. Blood culture was positive in
centration ≥ 0.5 ng/ml, this sandwich complex can be
19
(22.4%) of the neonates. The sepsis grading and the
seen as a reddish band. The colour intensity of the band
differences between sepsis groups are shown in Table 1.
of
a PCT Q test kit is directly proportional to the PCT
concentration of the sample and is related to the follow-
Table 1: Sepsis
Grading and
Characteristics of
Study Popula-
ing PCT concentration ranges:< 0.5 ng/ml (At PCT <
tion
0.5 ng/ml - Systemic infection/sepsis is not likely ), ≥
11
Characteristics
Total
Group I
Group II
Group III
0.5 ng/ml (At PCT > 0.5 and < 2 ng/ml- Moderate risk
(n=
85)
(n=
19)
(n=
18)
(n=
48)
Age
for progression to severe systemic infection ), ≥ 2 ng/
11
<3 Days
55
14
(25.5)
08
(14.5)
33
(60)
ml, (PCT> 2 and < 10 ng/ml- High risk for progression
> 3 Days
30
5
(16.7)
10
(30.3)
15
(50)
to
severe systemic infection ), ≥ 10 ng/ml. (PCT > 10
11
EGA
ng/ml-High likelihood of severe sepsis or septic shock )
11
Preterm
32
11
(34.3)
03
(09.4)
18
(56.3)
Term
53
08
(15.1)
15
(28.3)
30
(56.6)
According to clinical symptoms of sepsis, microbiologic
Birth weight / g
and laboratory results, neonates classified in to different
Low
39
10
(25.6)
08
(20.5)
21
(53.8)
categories of infection (similar to previous studies by
Normal
46
09
(19.6)
10
(21.7)
27
(58.7)
17
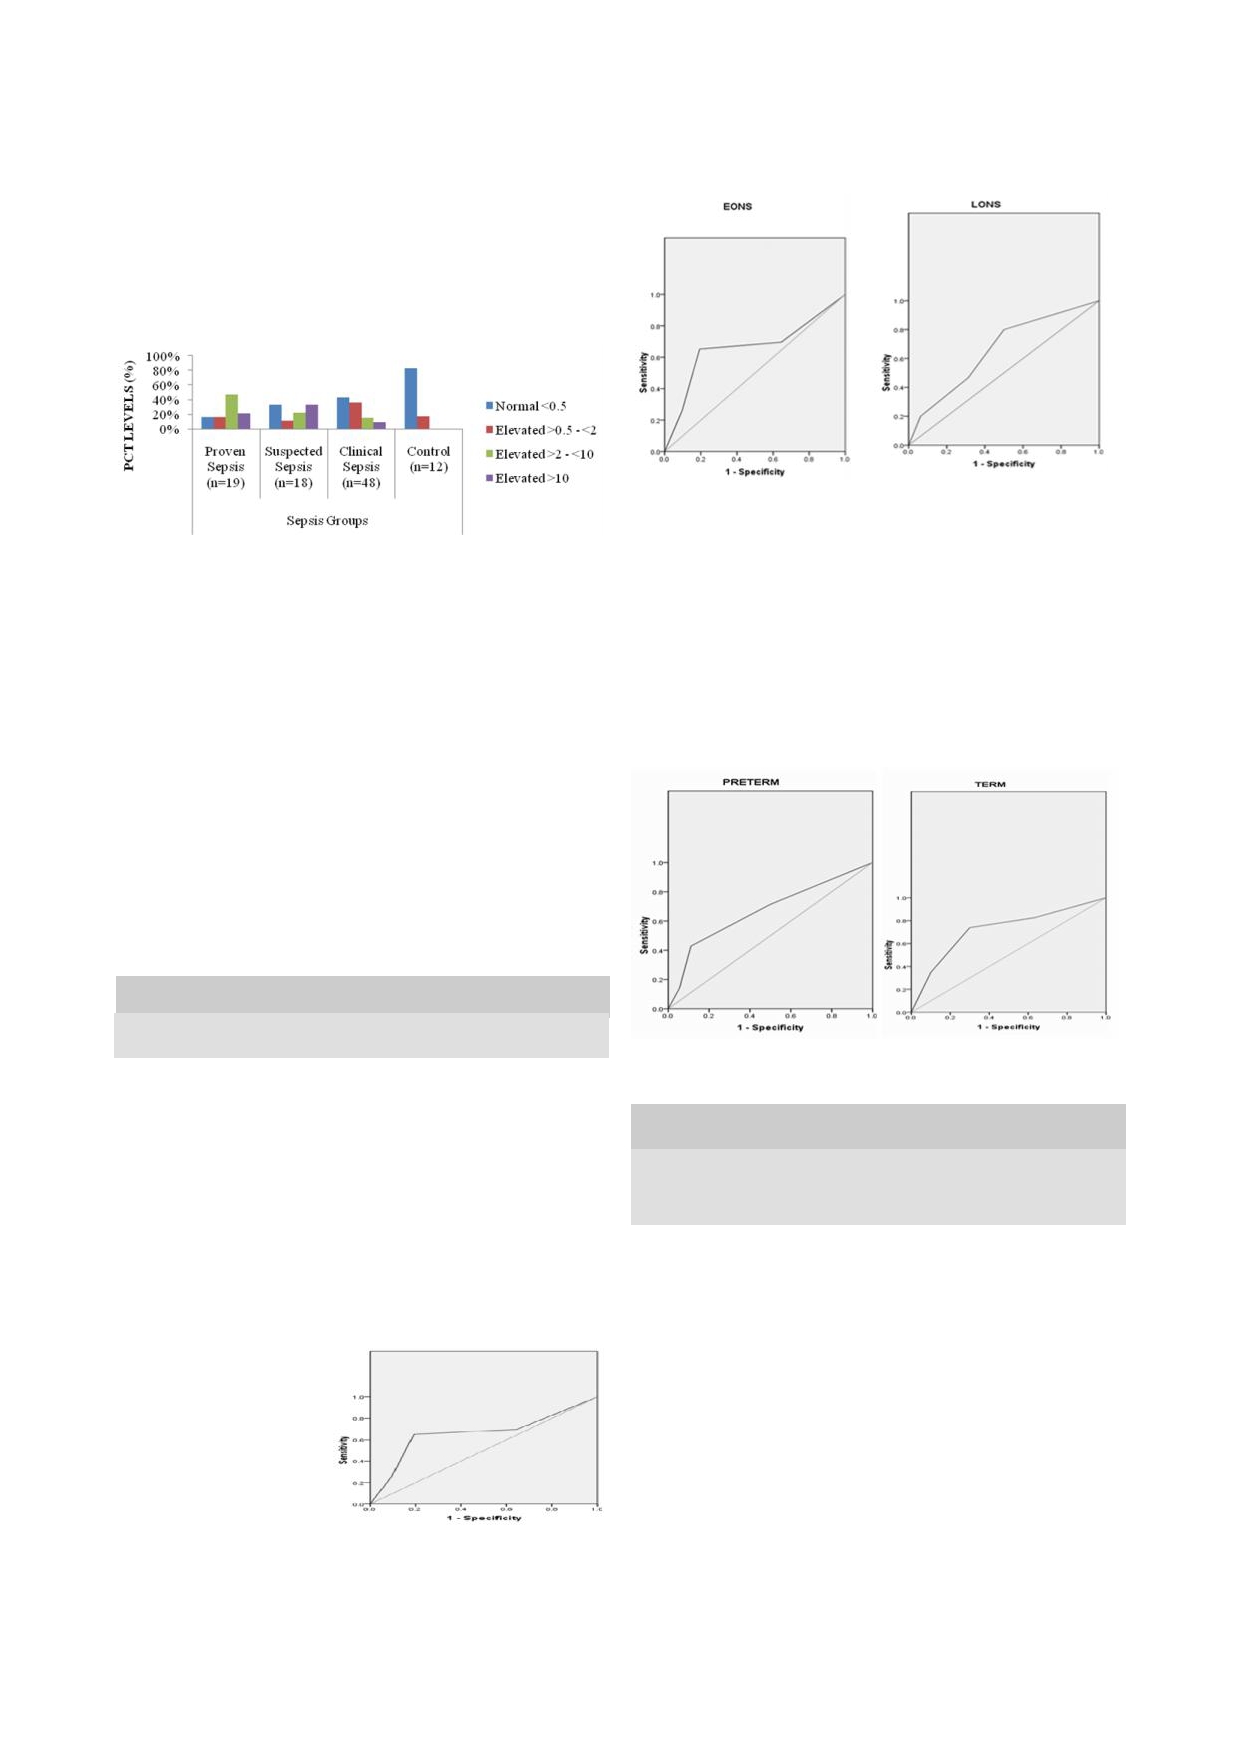
Procalcitonin Results
Fig 3a and b :
ROC curves
comparing the
sensitivity and
specificity of
serum PCT in neonates with EONS and LONS (Area under the curves
=
0.662 and 0.658 for EONS and LONS respectively).
Fifty five (64.7%) of the patients had elevated PCT val-
ues (>0.5ng/ml). Elevated PCT levels were recorded in
84.2%, 66.7%, 57.4% and 16.7% of neonates in the
proven, suspected, clinical and control groups respec-
tively.
Fig 1: Procalcitonin
Levels In
Sepsis Groups
(a)
(b)
A
higher proportion of neonates with respiratory distress
and convulsion compared to neonates without these
PCT level was significantly higher (PCT >0.5) in infants
sign/symptom had elevated PCT levels. These differ-
in
all sepsis groups (Proven, Suspected or Clinical) com-
ences were statistically significant. (p<0.05) Also, a
pared with the control group (p-value < 0.05) More than
higher percentage of neonates who died compared to
two-third of patients with proven sepsis and more than
neonates who were discharged had elevated PCT levels
half of patients with suspected sepsis had PCT values
and the difference was statistically significant. (p<0.000)
indicating a high risk for progression to severe systemic
infection or septic shock. Majority of patients with clini-
Fig 4 :
ROC curves
comparing the
sensitivity and
specificity of
serum
cally suspected sepsis had PCT values indicating a low
PCT
in Preterm and Term neonates (Area under the curves = 0.671
and
0.722 respectively).
or
moderate risk for progression to severe systemic in-
fection.
Sensitivity, Specificity, PPV and NPV
As
cut off values increased, Specificity, PPV, and FN
increased while Sensitivity and FP decreased. Overall,
using a cut-off of 0.5 ng/ml, the NPV of PCT was 69%
and the PPV 50%. (Table 2).
Table 2: Predictive
Values For
Various Cut-Offs
of PCT
Cut
off Values
0.5ng/mL
2.0ng/Ml
10ng/Ml
Sensitivity
75.7
62.2
27.0
(a)
(b)
Specificity
41.7
77.1
91.7
PPV
50.0
67.7
71.4
Table 3: Procalcitonin
Levels in
relation to
Clinical Findings
NPV
69.0
72.6
62.0
and
Outcome of Management
FP
58.3
22.9
8.3
Clinical Signs/
Variables
To-
Normal
Elevated
P
Symptom and
tal
(n=30)
(n=55)
value
FN
24.3
37.8
73.0
Outcome of Man-
agement
Receiver operating characteristics (ROC) analysis
Respiratory distress
Present
39
09
(23.1%)
30
(66.9%)
0.030
Absent
46
21
(45.7%)
25
(54.3%)
Poor
Cry
Present
11
02
(18.2%)
09
(81.8%)
0.350
The ROC AUC for the whole group was 0.686 (Fig: 2).
Absent
74
28
(37.8%)
46
(62.2%)
No
significant statistical difference was found between
Palor
Present
03
00
(0.0%)
03
(100%)
0.492
the AUC values of PCT in Preterm or Term cases.
Absent
82
30
(36.6%)
52
(63.4%)
Abdominal disten-
Present
04
01
(25%)
03
(75%)
sion
Absent
81
29
(35.8%)
52
(64.2%)
Fig 2: ROC
Curve for
all
Fever
Present
21
05
(23.8%)
16
(76.2%)
0.204
neonates (Area under the
Absent
64
25
(39.1%)
39
(60.1%)
curve = 0.686)
High Pitched Cry/
Present
04
03
(75%)
01
(25%)
0.243
Irritability
Absent
71
27
(38%)
54
(62%)
Apnea
Present
04
00
(0.0%)
04
(100%)
0.328
Absent
81
30
(37%)
51
(63%)
Convulsion
Present
21
03
(14.3%)
18
(85.7%)
0.031
Absent
64
27
(42.2%)
37
(57.8%)
Refusal to Feed
Present
23
06
(26.1%)
17
(73.9%)
0.279
Similarly, there was no statistically significant differ-
Absent
62
24
(38.7%)
38
(61.3%)
ence between the AUC values of PCT in EONS or
*Outcome of
Discharge
48
26
(54.2%)
22
(45.8%)
0.000
LONS cases.
Management
Death
27
01
(3.7%)
26
(96.3%)

18
*Ten of the neonates were discharged against medical advice and were
excluded
22
from this analysis
al .,
2007 ,
where ROC
analysis had
an area
of 0.631.
23
Boraey, et
al ., 2012 reported an AUC value of 0.92 for
PCT at a cut off value of 1.3ng/ml. AUC values were
0.662 and 0.658 for Preterm and Term neonates respec-
Discussion
tively without any significant statistical difference. This
Neonatal sepsis still remains a diagnostic and treatment
is
in agreement with the reports of White
et al .,
2007
.Also, no significant statistical difference was
22
challenge for the neonatal health care providers. This
challenge leads to the over treatment of large number of
found between the AUC values of PCT in EONS and
neonates who present with clinical suspicion of sepsis .
15
LONS
cases. This suggests that the PCT seems to be
In
recent years measurement of procalcitonin and other
equally accurate for the diagnosis of neonatal sepsis in
inflammatory mediators have been reported as sensitive
preterm and term neonates; as well as in EONS and
parameters for the early diagnosis of neonatal sepsis and
LONS
cases.
evaluating its outcome . The aim of this study was to
16
evaluate PCT as diagnostic marker for neonatal sepsis.
The result from this study suggests PCT as a good pre-
The incidence of culture-proven sepsis was low (22%).
dictor of mortality as almost all neonates who died
This is consistent with the reports of incidence of 20%
(96.3%) had elevated PCT. This is in agreement with
Adib, et
al ., 2012 .
24
and 25.7% by Adeleke and Belonwu, 2006 , and Naher
17
and Khamel, 2013 respectively. This corroborates pre-
18
vious reports on the low sensitivity of blood culture in
Limitation
neonatal sepsis . PCT levels were high in the neonates
2
with proven and suspected sepsis cases. This finding
The overall diagnostic value of PCT for neonatal sepsis
was similar with reports of some studies
19,
20
.
Three neo-
could probably be improved if PCT was measured more
nates in the proven sepsis group had PCT lower than
precisely with an ultrasensitive PCT assay instead of the
0.5ng/ml. These neonates were preterm and two had
semiquantitative assay used in this study. Another limi-
very low birth weights. Two of the 12 neonates in the
tation of our study may be the modest prevalence culture
control group had procalcitonin higher than 0.5 ng/ml.
proven sepsis in this study, which, of course, directly
This may be due to physiological increase of procalci-
influences the values of PCT as a biomarker for neonatal
tonin, reported up to 21-48 hr postpartum, even in the
sepsis. With the use of more sophisticated diagnostic
absence of infection. The postnatal increase of PCT ob-
techniques like PCR, a causative bacterial micro-
served in the healthy neonate with peak values at 24 h of
organism might have been demonstrated in a subset of
age most likely represents endogenous synthesis .
21
neonates allocated to the group “suspected sepsis.” Also,
a
better comparism would have been achieved using a
In
this study, at a cut-off point of 0.5ng/ml, the sensitiv-
sufficient population of control. The population of con-
ity and specificity, PPV and NPV of PCT in neonatal
trol in this study was limited.
sepsis was found to be 89% and 23%, 84% and 83%
respectively for proven infection. This high sensitivity
and NPV of PCT is consistent with the reports of Ballot
et al .,
2004 in
South Africa
and Sucilathangam, et al .,
12
Conclusion
in
2012 in India. White, et
al ., in 2007 in South Africa
20
22
recorded similar report of NPV of 80%, but a lower sen-
These findings support the usefulness of the PCT to sup-
sitivity of 48%. NPV and Sensitivity increased to 100%
port an early diagnosis of neonatal sepsis. Results from
and specificity 56% as cut off values increased to 10
this study suggest that any increase in PCT in an ill neo-
while PPV dropped to 21%.In the study of White, et
al .,
nate suggests the possibility of a septicemic infection.
in
2007 , increased cut-off value (10.1 ng/ml) had no
22
However, PCT is not sufficiently reliable to be the sole
effect on the NPV, worsened the sensitivity (98% v.
marker of neonatal sepsis and would be useful as part of
22%, respectively), but improved the PPV (78% v. 79%,
a
full sepsis evaluation. A negative PCT on presentation
respectively), and the specificity (74%v.98%).
is
not exclusively sufficient to rule out sepsis, but needs
ROC analysis for PCT had an area under the curve
to
be evaluated further. PCT is also of great advantages
(AUC) of 0.686 which is similar to reports of White,
et
where prediction of severity and mortality is concerned.
References
1.
Osrin, D, Vergnano, S,
2.
Weinberg, GA, Powell, KR.
3.
Black S, Kushner I, Samols D.
Costello, A. Serious bacterial
Laboratory aids for diagnosis
C-reactive protein. Mini re-
infections in newborn infants
of
neonatal sepsis. Infectious
view. J.
Biol. Chem.
in
developing countries. Curr.
diseases of the fetus and new-
2004;279:48487-48490.
Opin. Infect.
Dis. 2004;17:217
born infant. fifth edition. Ed-
4.
Christ-Crain, M, Muller, B.
-224.
ited by Remington, JS. and
Procalcitonin in bacterial infec-
Klein, JO. Philadelphia,
Saun-
tions – hype, hope, more or
ders. 2001;1327-1344.
less? Swiss
Med Wkly.
2005;135:451 – 460.

19
5.
Assicot, M, Gendrel, D, Carsin,
12. Ballot, DE, Perovic, O, Galpin,
20. Sucilathangam G, Amuthavalli
H,
Raymond, J, Guilbaud,
J,
Cooper, PA. Serum procalci-
K., Velvizhi G, Ashihabegum
J,Bohuon, C. High serum pro-
tonin as an early marker of
MA, JeyamuruganT, Palaniap-
calcitonin concentrations in
neonatal sepsis. S. Afr.
Med. J.
pan N. Diagnostic Markers for
patients with sepsis and infec-
2004; 94: 851-54
Neonatal Sepsis: Comparing
tion. Lancet.
1993;341:515-
13. Magudumana MO, Ballot DE,
Procalcitonin (PCT) and C-
518
Cooper PA, et al. Serial inter-
Reactive Protein (CRP). J.Clin.
6.
Dandona, P, Nix, D, Wilson,
leukin 6 measurements in the
Diagn. Res. 2012;6(4):627-631
MF,
Aljada, A, Love, J, Assi-
early diagnosis of neonatal
21. Assumma M, Signore F,
cot, M. Procalcitonin increase
sepsis. J
Trop Pediatr2000;
46
Pacifico L, Rossi N, Osborn JF
after endotoxin injection in
(5): 267-271.
Chiesa C.Serum Procalcitonin
normal subjects. J
Clin Endo
14. Zweig MH, Campbell G. Re-
Concentrations in Term Deliv-
Met. 1994;79:1605-1608
ceiver-operating characteristic
ering Mothers and Their
7.
Karzai, W, Oberhoffer, M,
(ROC) plots: a fundamental
Healthy Offspring: A Longitu-
Meier-Hellmann, A, Reinhart,
evaluation tool in clinical
dinal Study. Clin
Chem 2000;
K.
Procalcitonin a new indica-
medicine. Clin
Chem 1993;
46(10): 1583-1587.
tor
of the systemic response to
39:561-577.
22. White, D, Ballot, M, Cooper, P,
severe infections. Infect.
15. Naher, BS, Mannan, MA,
Perovic, O, Galpin, J. Can a
1997;25: 329 – 334.
Noor, K. Role of serum procal-
negative procalcitonin level
8.
LópezSastre, JB, Coto-Cotallo,
citonin and C-Reactive Protein
guide antibiotic therapy in early
GD, Fernández CB, Castrillo,
in
the diagnosis of neonatal
-onset neonatal sepsis? South
G.
Neonatal sepsis of vertical
sepsis. Bangladesh
Med Re-
Afri J Child Hlth. 2007;1(4).
transmission: an epidemiologi-
search Council Bull. 2011;37:
23. Boraey, NF, Sheneef, A,
cal study from the "Grupo de
40-46.
Mohammad, MA, Yousef, LM.
HospitalesCastrillo". J
Perinat
16. Lachowska M, Gajewska E.
Procalcitonin and C-Reactive
Med. 2000;28: 309-315.
Usefulness of procalcitonin
Protein as diagnostic marker of
9.
Pérez Solís, D, LópezSastre,
(PCT) as a marker of early-
neonatal sepsis. Aust.
J. Basic.
JB, CotoCotallo, GD, Diégu-
onset
systemic infections in
Applied. Sc. 2012; 6(4): 108-
ezJunquera, MA, Deschamps-
preterm newborns. Med.
Sci.
114.
Mosquera, EM, Crespo
Monit. 2004;10: 33-35.
24. Adib, M, Bakhshiani, Z,
Hernández, M. Procalcitonina
17. Adeleke, SI, and Belonwu, RO.
Navaei, F, Fosoul F, Fouladi,
para
el diagnóstico de sepsis
Bacterial Isolates in Neonatal
S,Kazemzadeh, H. Procalci-
neonatal de transmisión verti-
Septicaemia
in Kano, Nigeria.
tonin: A Reliable Marker for
cal. An
Pediatr (Barc).
Pinnacle Int. J. Med.
the Diagnosis of Neonatal Sep-
2006;64: 341-348.
Sci.2006;1(1): 17-20
sis. Iran
J Basic
Med Sci.
2012;
10. Koskenvuo, MM, Irjala, K,
18. Naher, HS, Khamael, AB. Neo-
15 (1):777
Kinnala, A, Ruuskanen,
natal Sepsis; The Bacterial
O,Kero, P. Value of monitor-
Causes and the Risk Factors.
ing serum procalcitonin in neo-
Int. J. Res. Med. Sci. 2013; 1
nates at risk of infection. Eur J
(6): 19-22.
Clin Microbiol Infect Dis.
19. Zahedpasha, Y, Ahmadpour-
2003;22: 377-378.
Kacho, M, Hajiahmadi, M,
11. American College of Chest
Haghshenas, M. Procalcitonin
Physicians/Society of Critical
as
a Marker of Neonatal Sepsis.
Care Medicine: Definitions for
Iran. J. Pediatr. 2009;19(2):
sepsis and organ failure and
117-122
guidelines for the use of inno-
vative therapies in sepsis. Crit
Care Med 1992, 20: 864-874